Turning fragmented rent data into real-time insights, helping property teams track collections, reduce manual reporting, and uncover at-risk residents faster.
Background
A potential client requested a delinquency forecasting tool to visualize aging rent and legal statuses. While exploring it, I realized the same data could also power a broader, long-term need, helping our clients track rent collection performance without relying on manual weekly reports.
Instead of designing a one-off feature, I saw an opportunity to turn this into a productized dashboard that could deliver real-time visibility and measurable value across clients.
My Role
Sole Product Designer (0 → 1) for Delinquency Dashboard
Product discovery and field research
Hi-fi prototyping
Roadmap planning & feature prioritization
The Opportunity
How Might We help regional and corporate teams monitor delinquency performance while reducing the manual work required from on-site leasing teams?
Process & Solution
Rapid Concept Validation
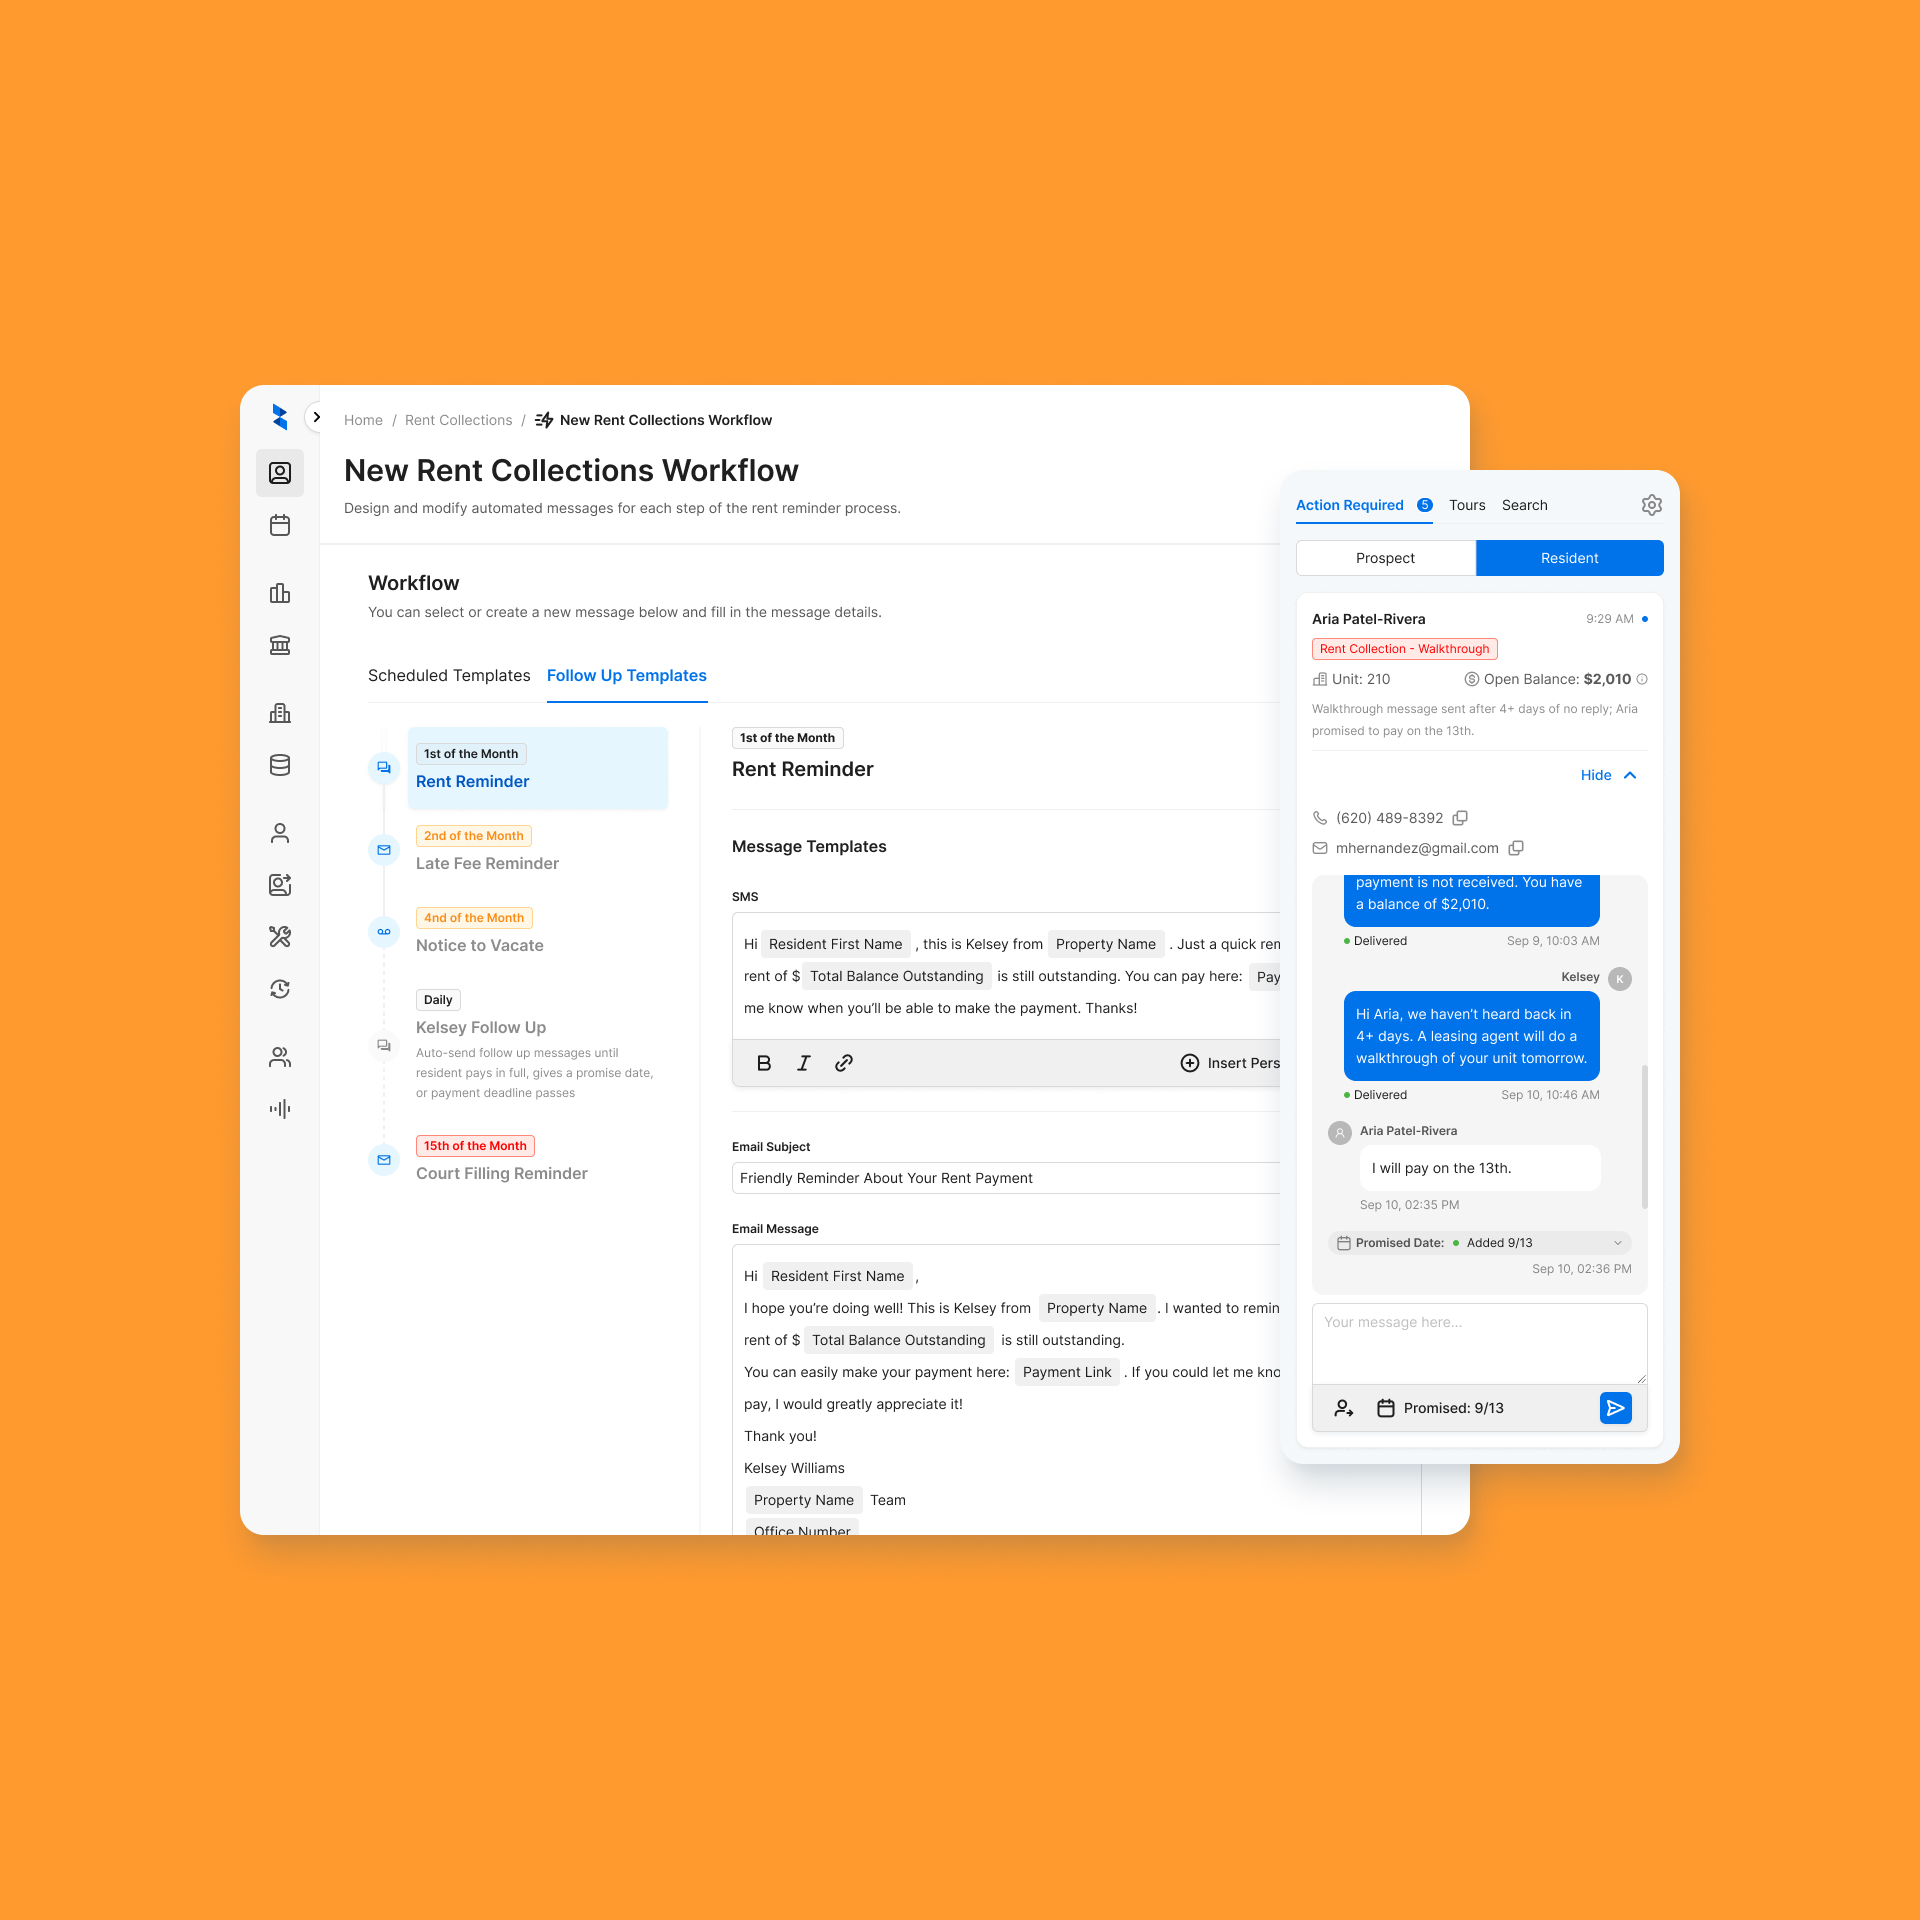
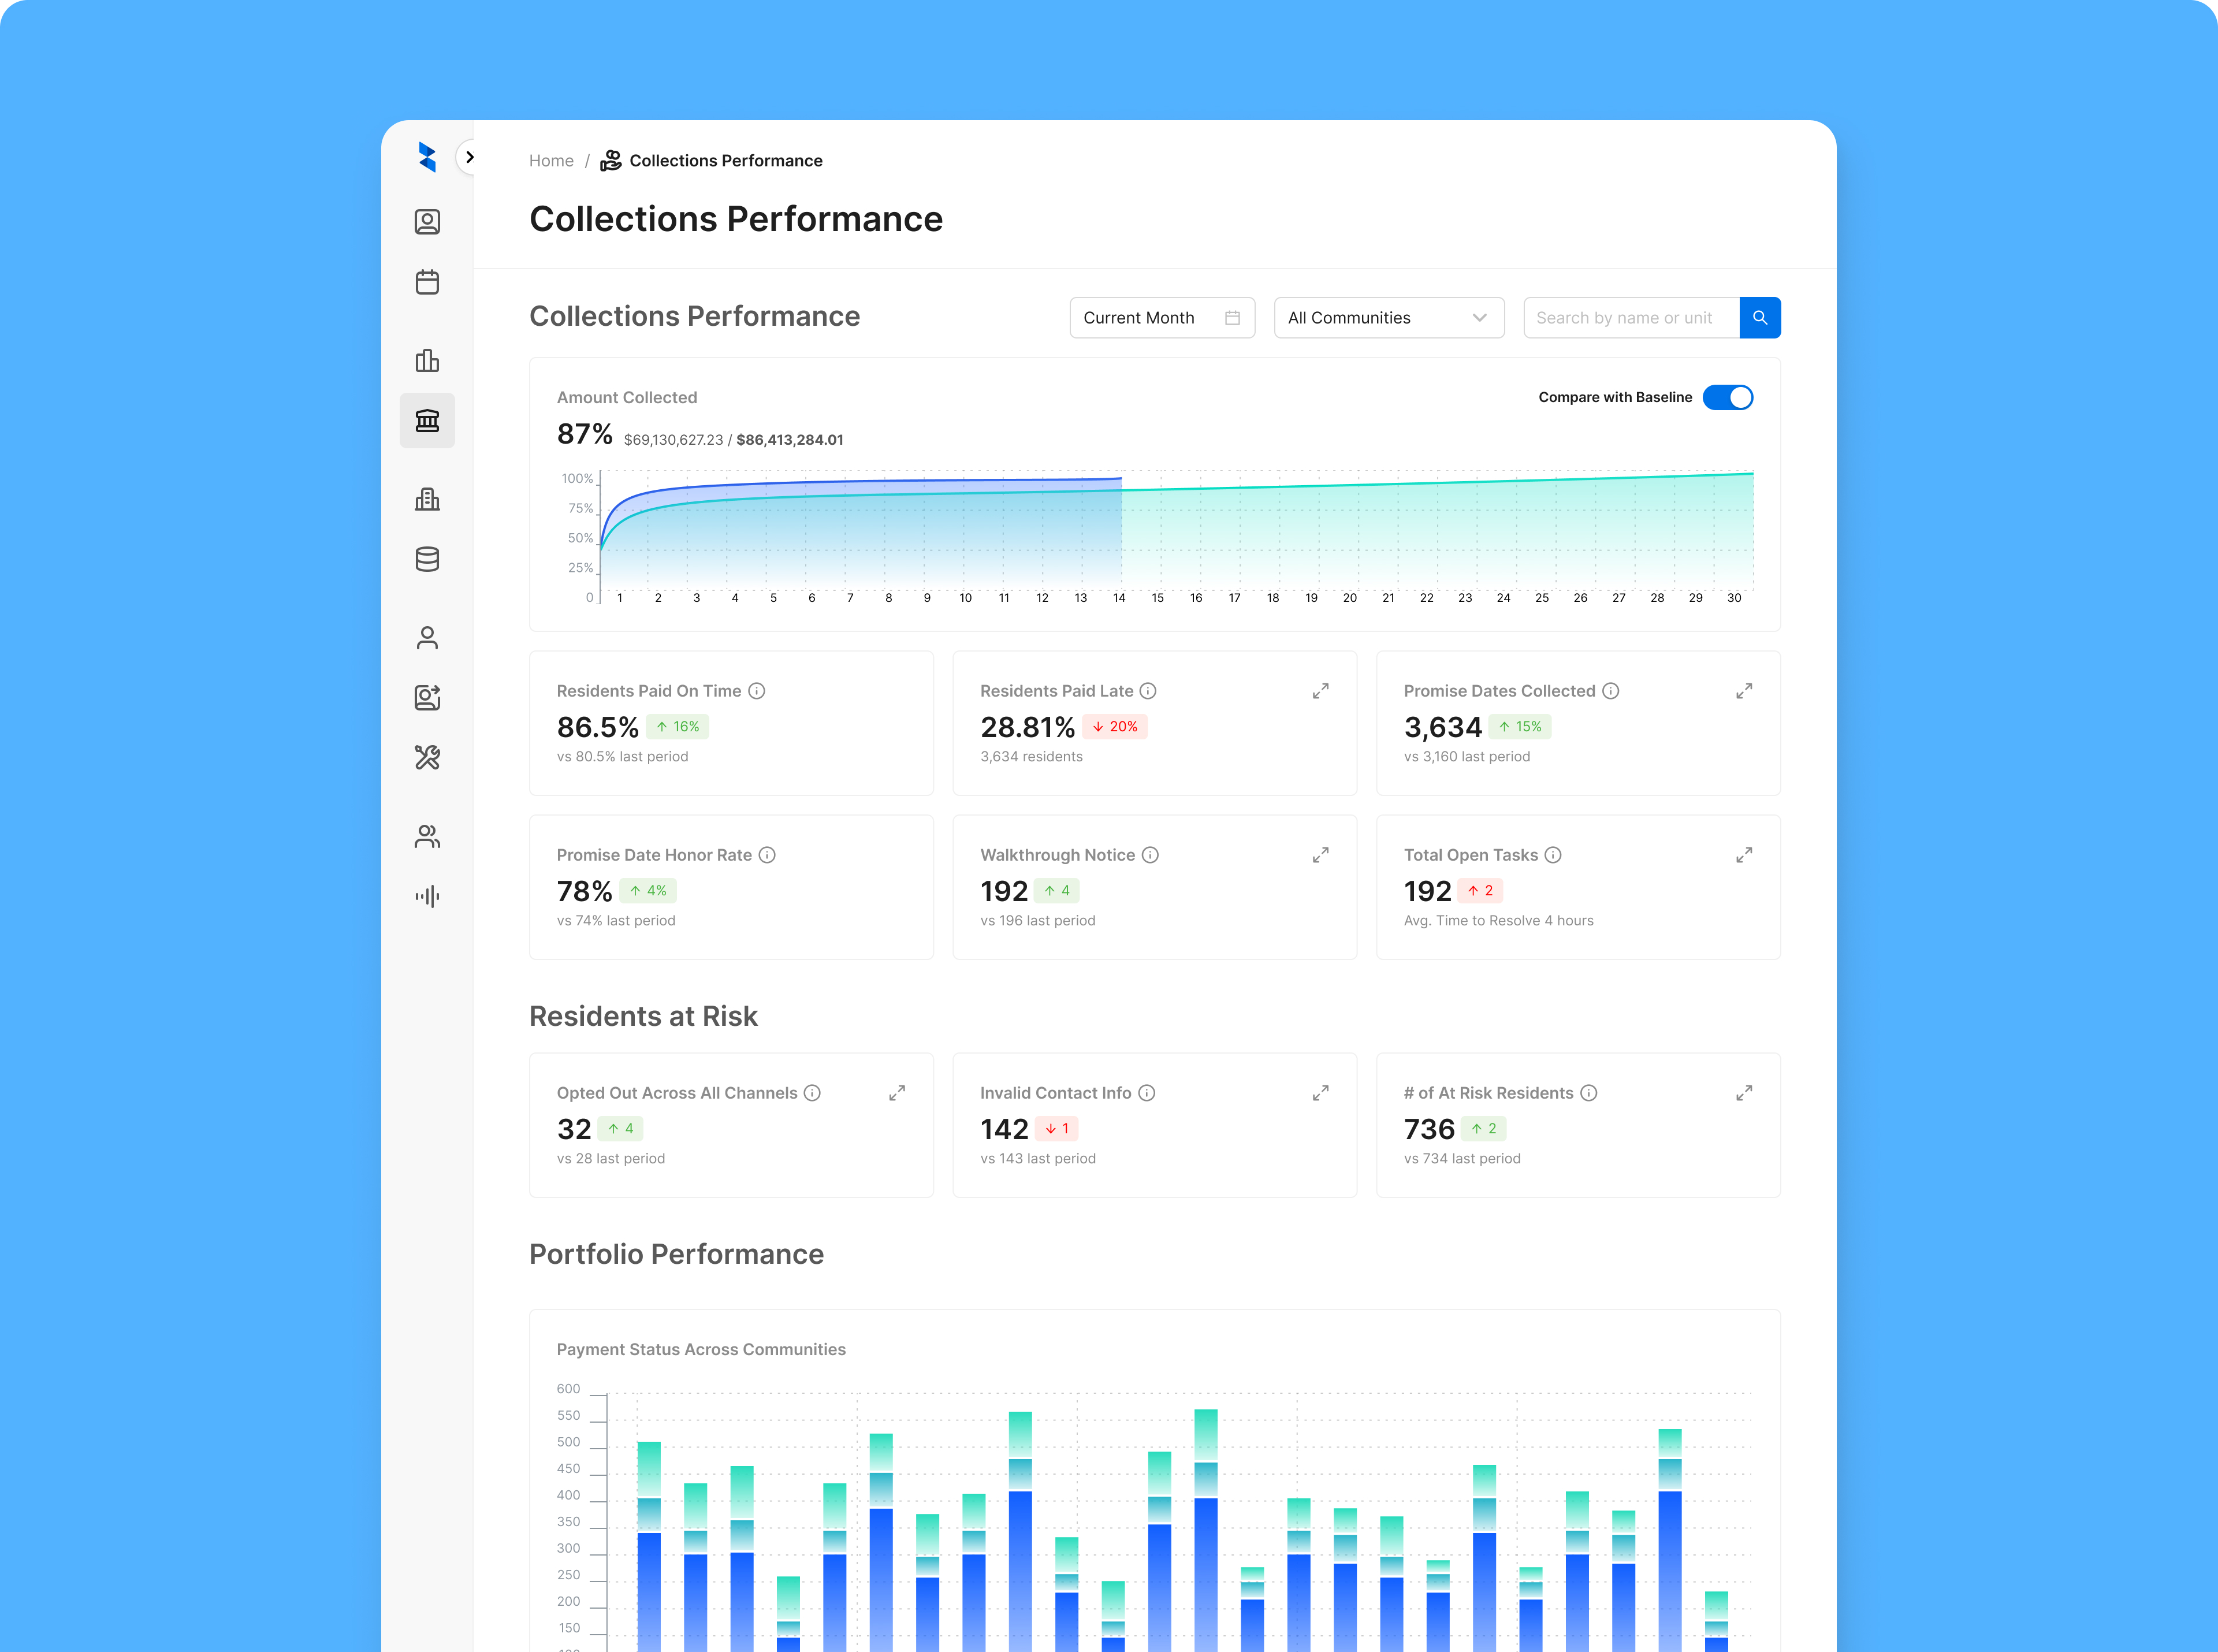
To test the concept fast, I built a high-fidelity prototype in Figma based on the client’s request and our existing weekly reports. The prototype explored two directions:
After presenting it internally, the CPO suggested emphasizing Zuma’s automation value. To make that measurable yet digestible, I added a “compare with baseline” toggle (using the average performance from the three months prior to onboarding) and early concepts for efficiency metrics like hours saved and response rates.
Field Research & Iterative Discovery
To validate the concept and uncover real needs, I conducted on-site contextual inquiries across five properties. I asked leasing agents, property managers, and regional managers to walk me through how they currently tracked rent collection, how they defined a “good month,” and how they evaluated Zuma’s performance.
Across 20+ interviews with leasing agents, property managers, regional leaders, and corporate staff, one theme stood out: every role valued transparency, but from a different perspective. Regional managers wanted portfolio-level visibility. Leasing teams wanted actionable next steps.
After each visit, I refined the prototype, adjusting metrics, data hierarchy, and copy based on feedback.
Refocusing on Reliable Data
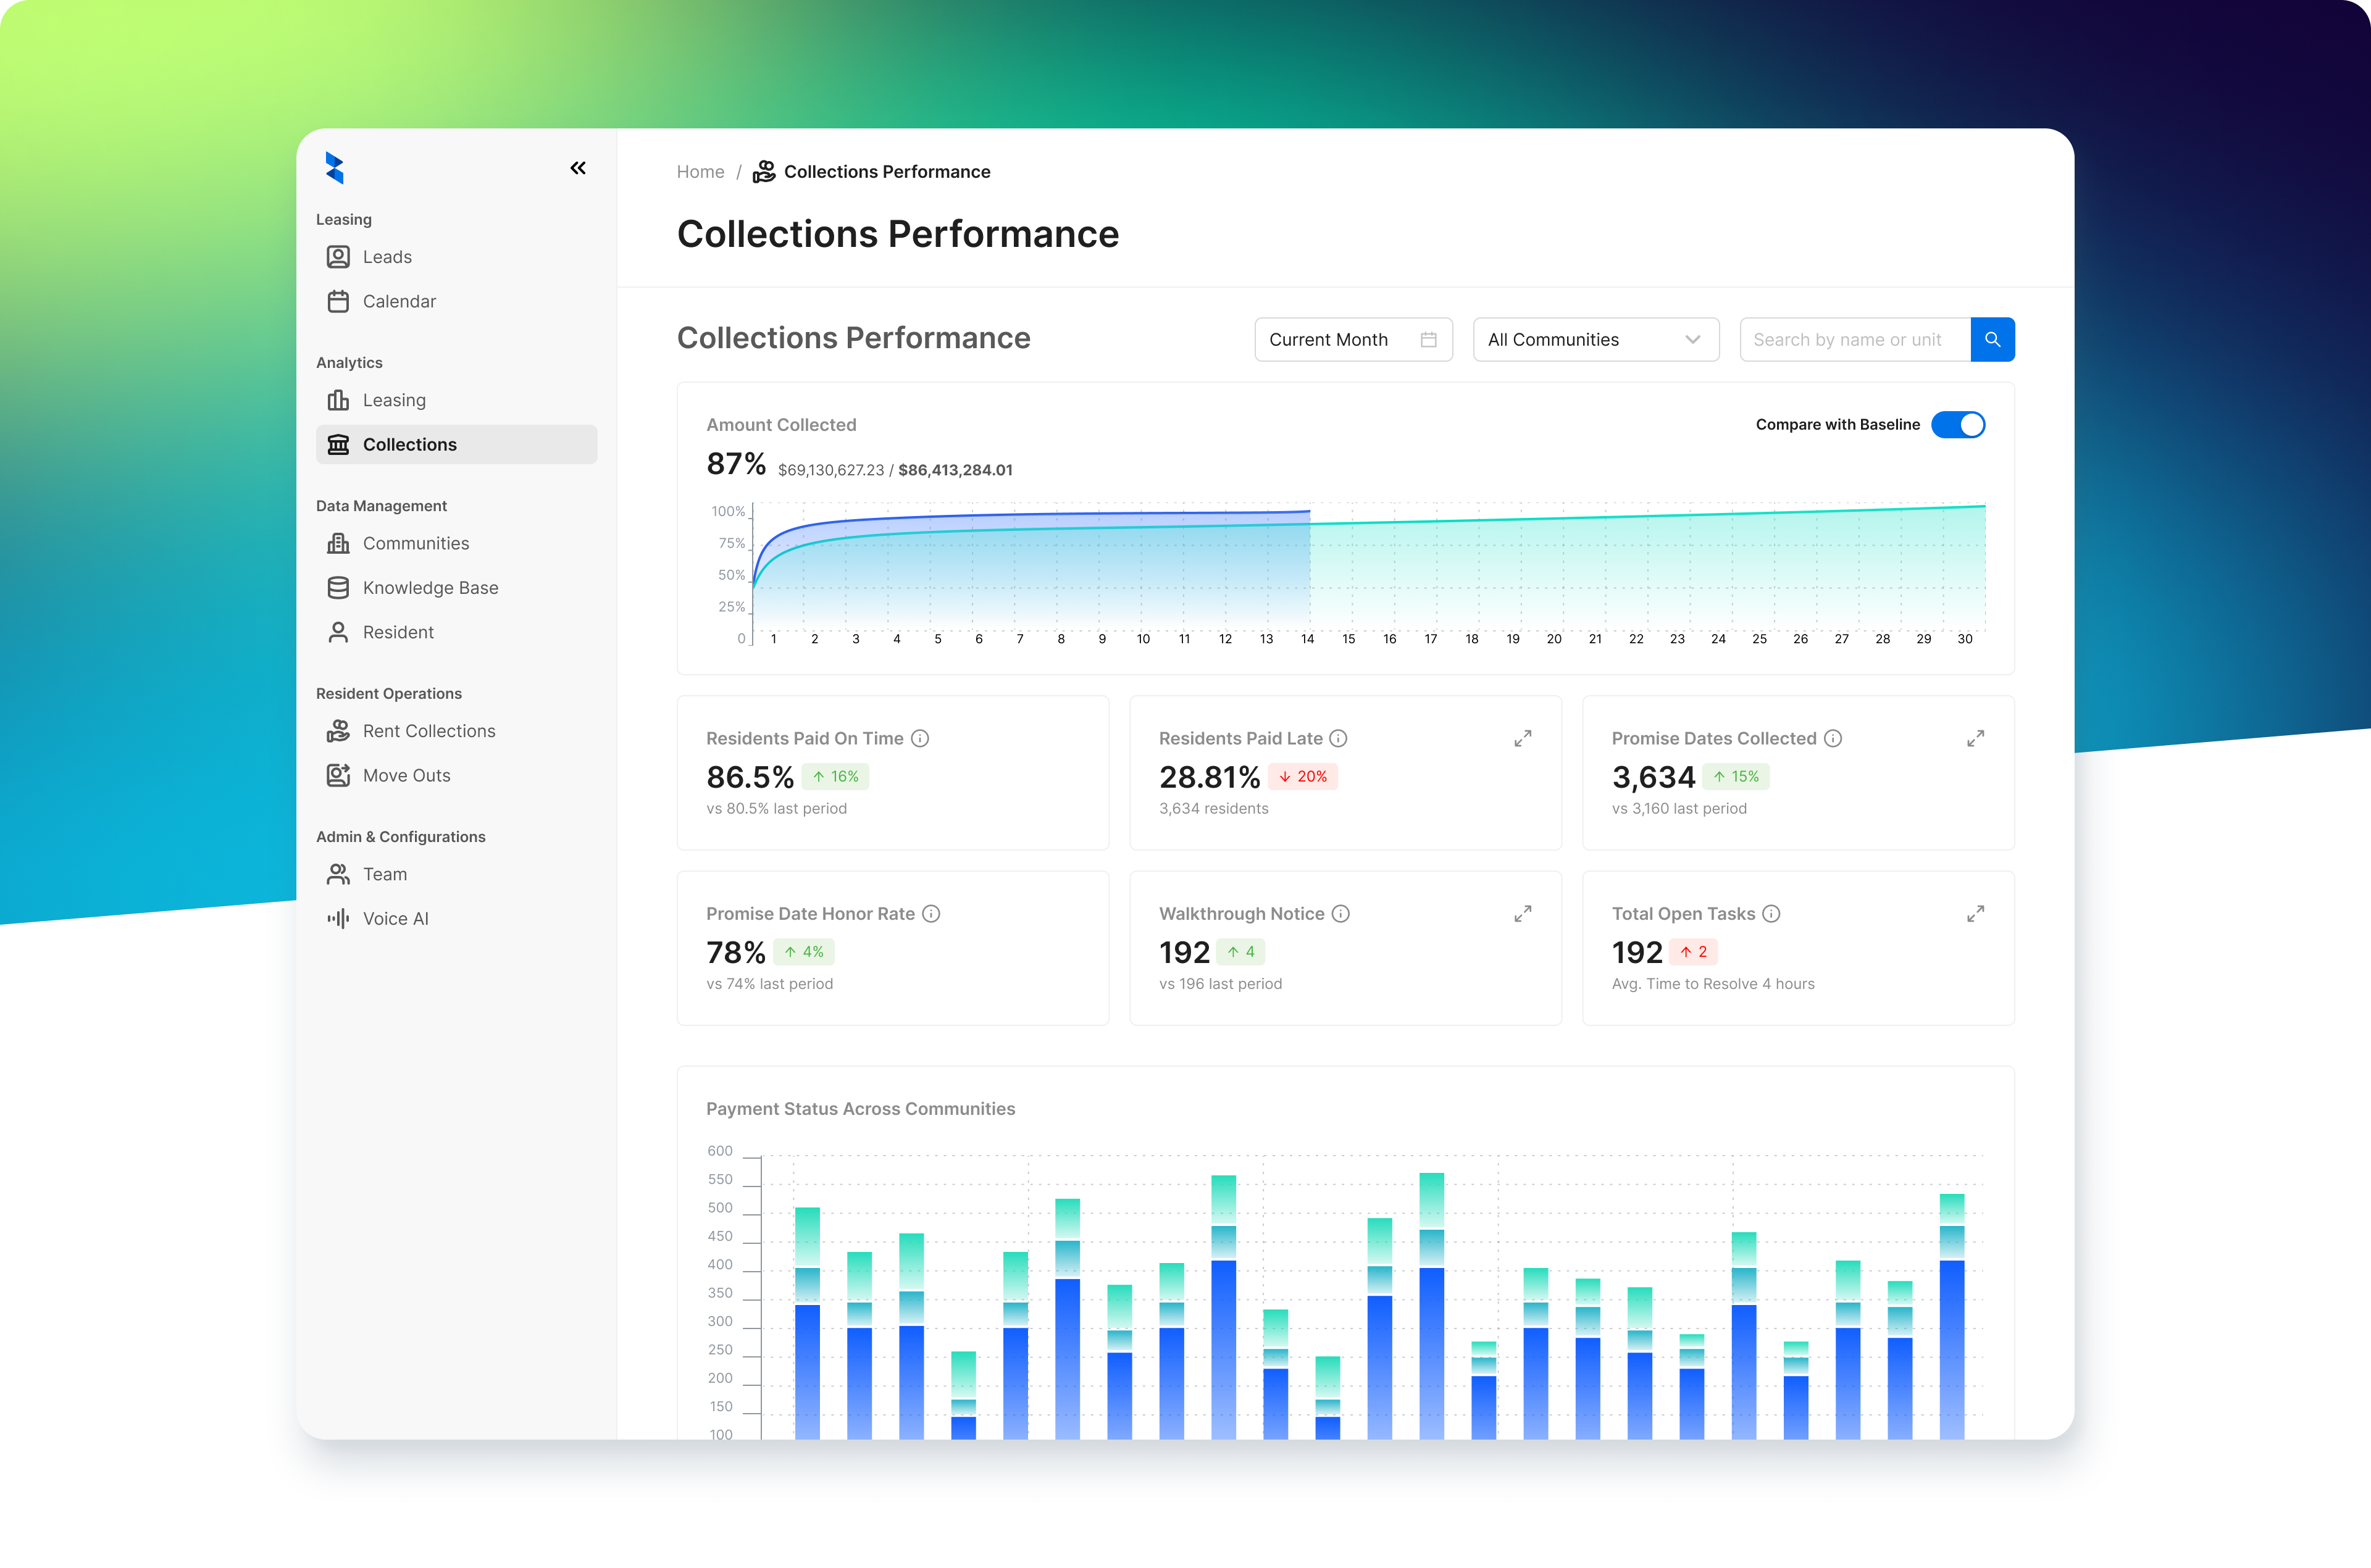
User feedback revealed a key insight: legal status data wasn’t reliable or automated. Tracking it would require manual updates, adding more work for leasing agents. Instead of forecasting delinquency, I shifted the product toward progress tracking, visualizing live rent collection data that was accurate, actionable, and immediately useful.
This decision reduced user effort, simplified data inputs, and aligned with how clients measured success: by how fast rent was collected and how much was still outstanding.
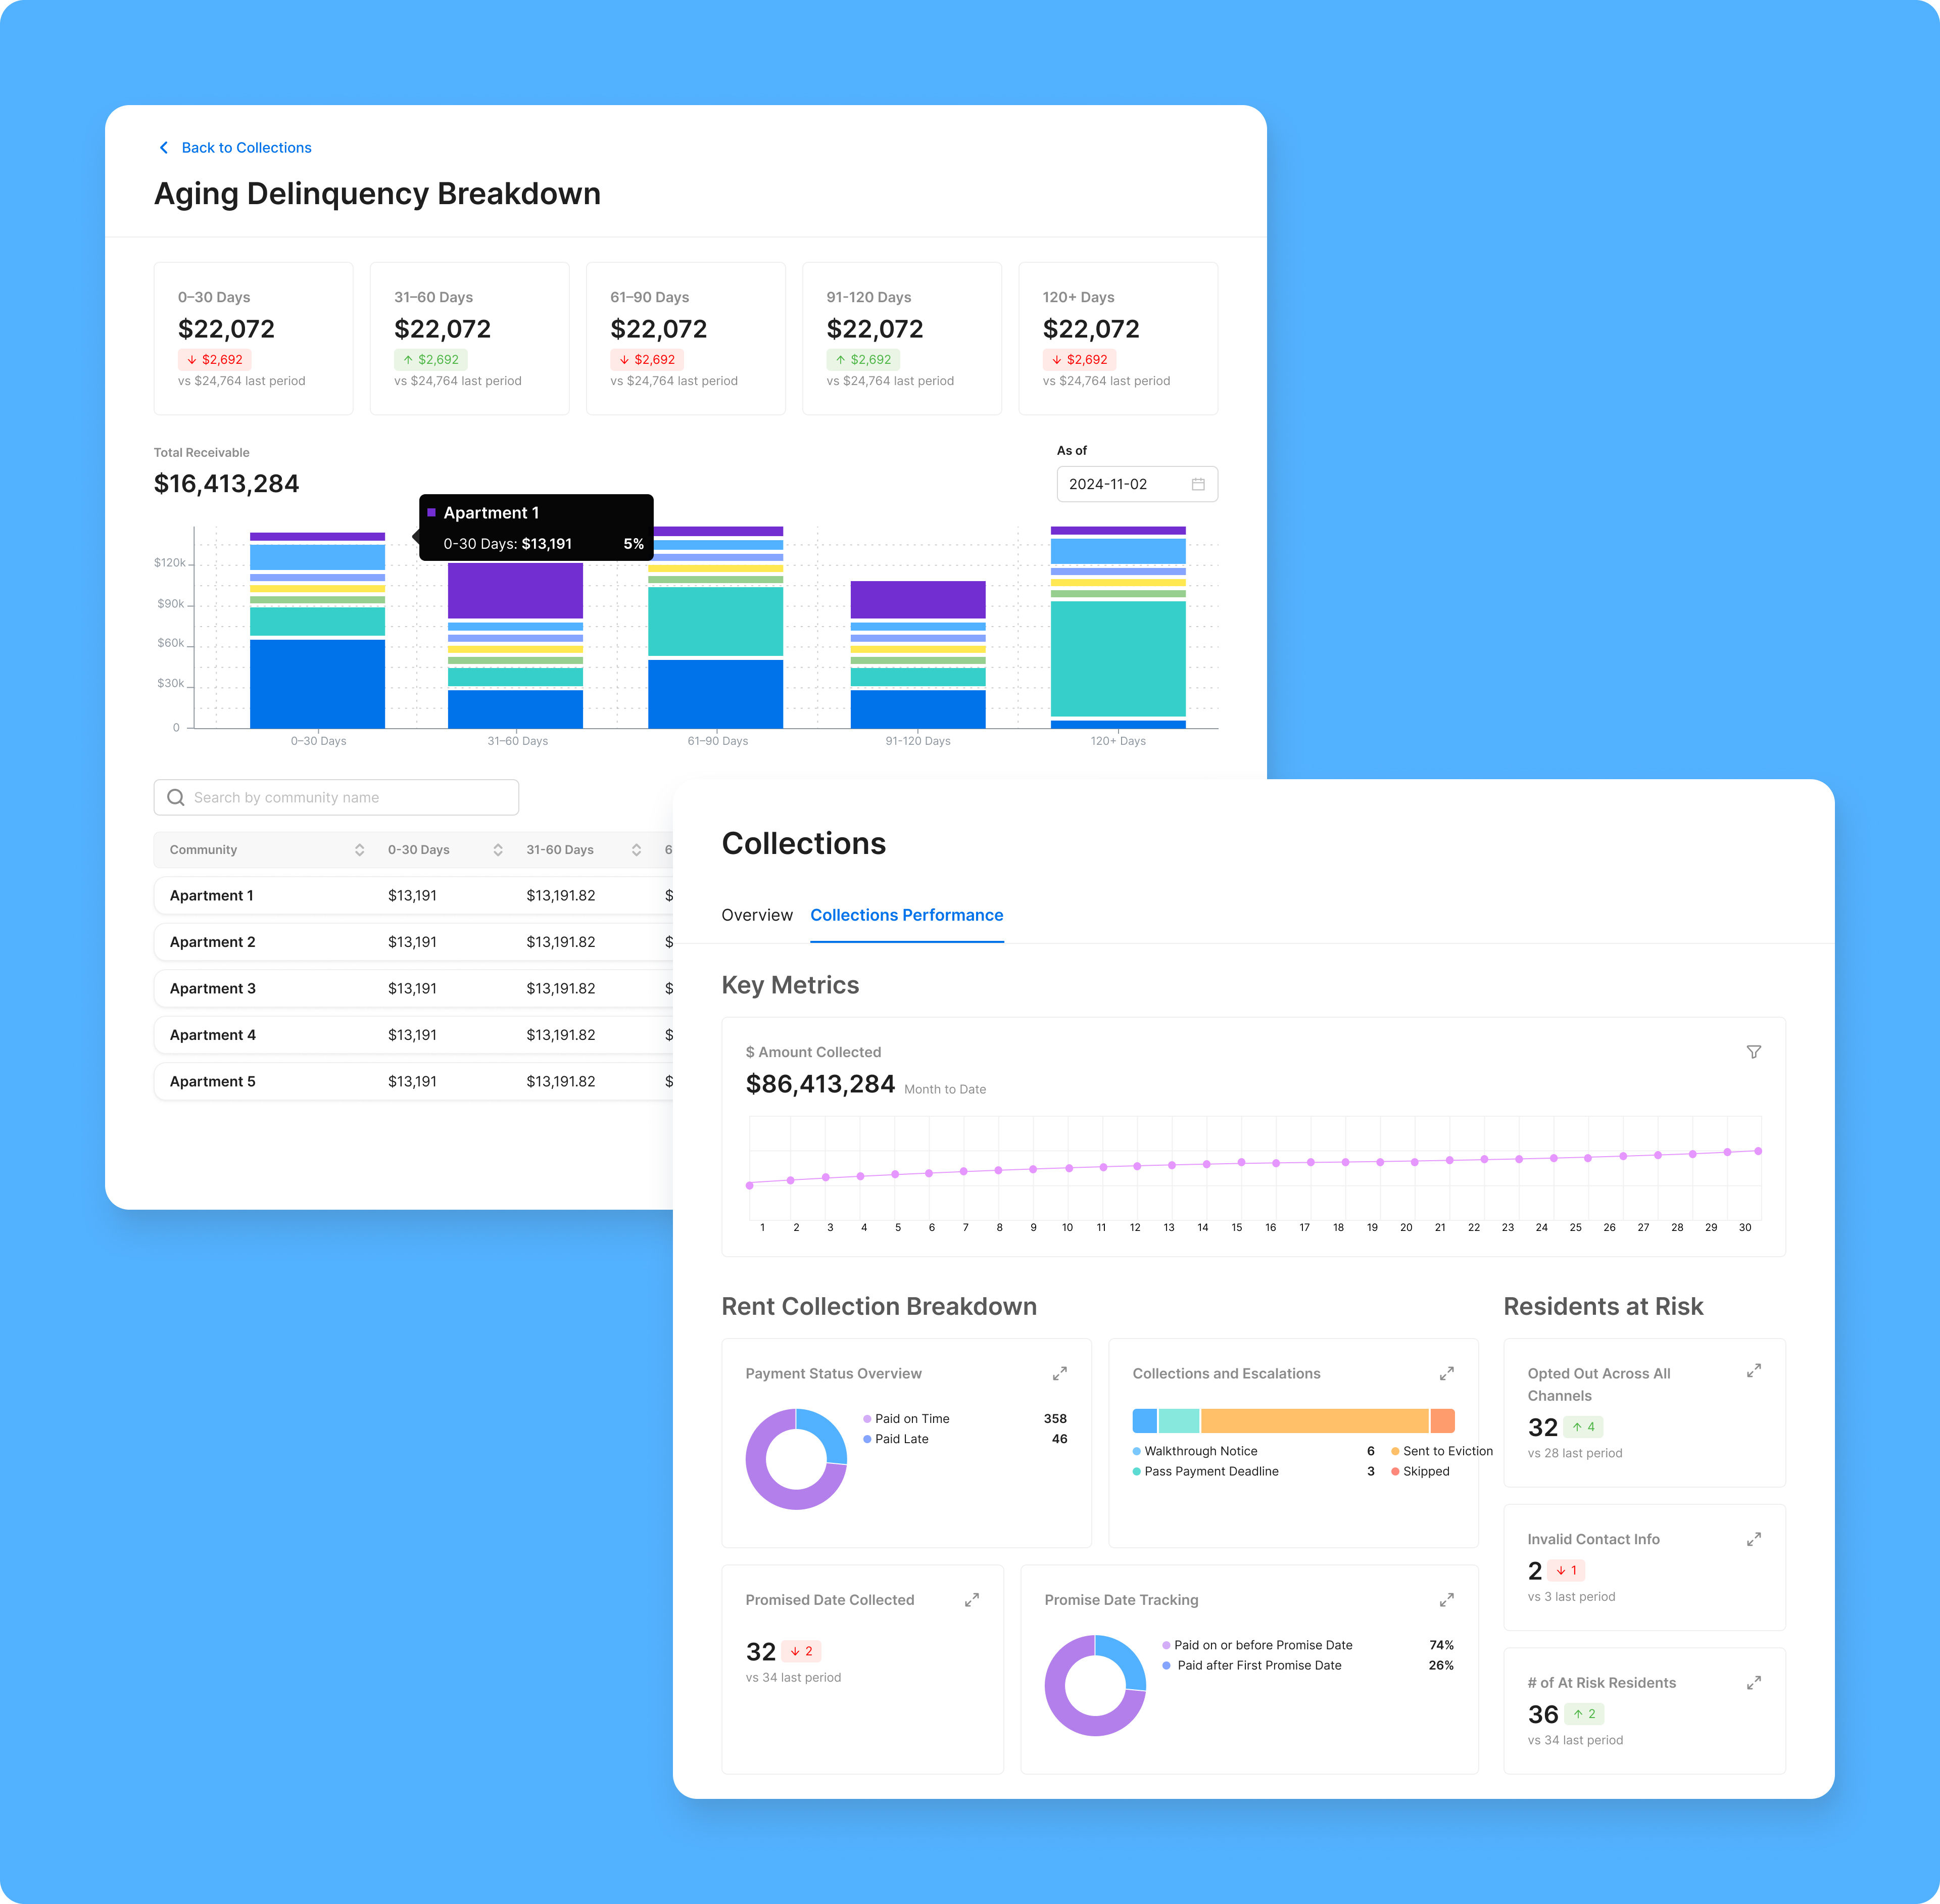
Designing for Multi-Level Transparency
Initially built for regional managers, the dashboard’s audience expanded after design partner feedback showed that on-site teams also relied on this information daily. Since our Chrome extension didn’t support multi-community tracking, I restructured the dashboard to serve all levels:
I also introduced a task card so leasing agents could see pending actions while managers could assess completion rates, a small addition that made the dashboard equally valuable for daily and strategic use.

Balancing Impact and Feasibility
Working closely with engineering and the CPO, I mapped features using an Impact vs. Effort matrix to prioritize delivery. This led to a phased rollout:
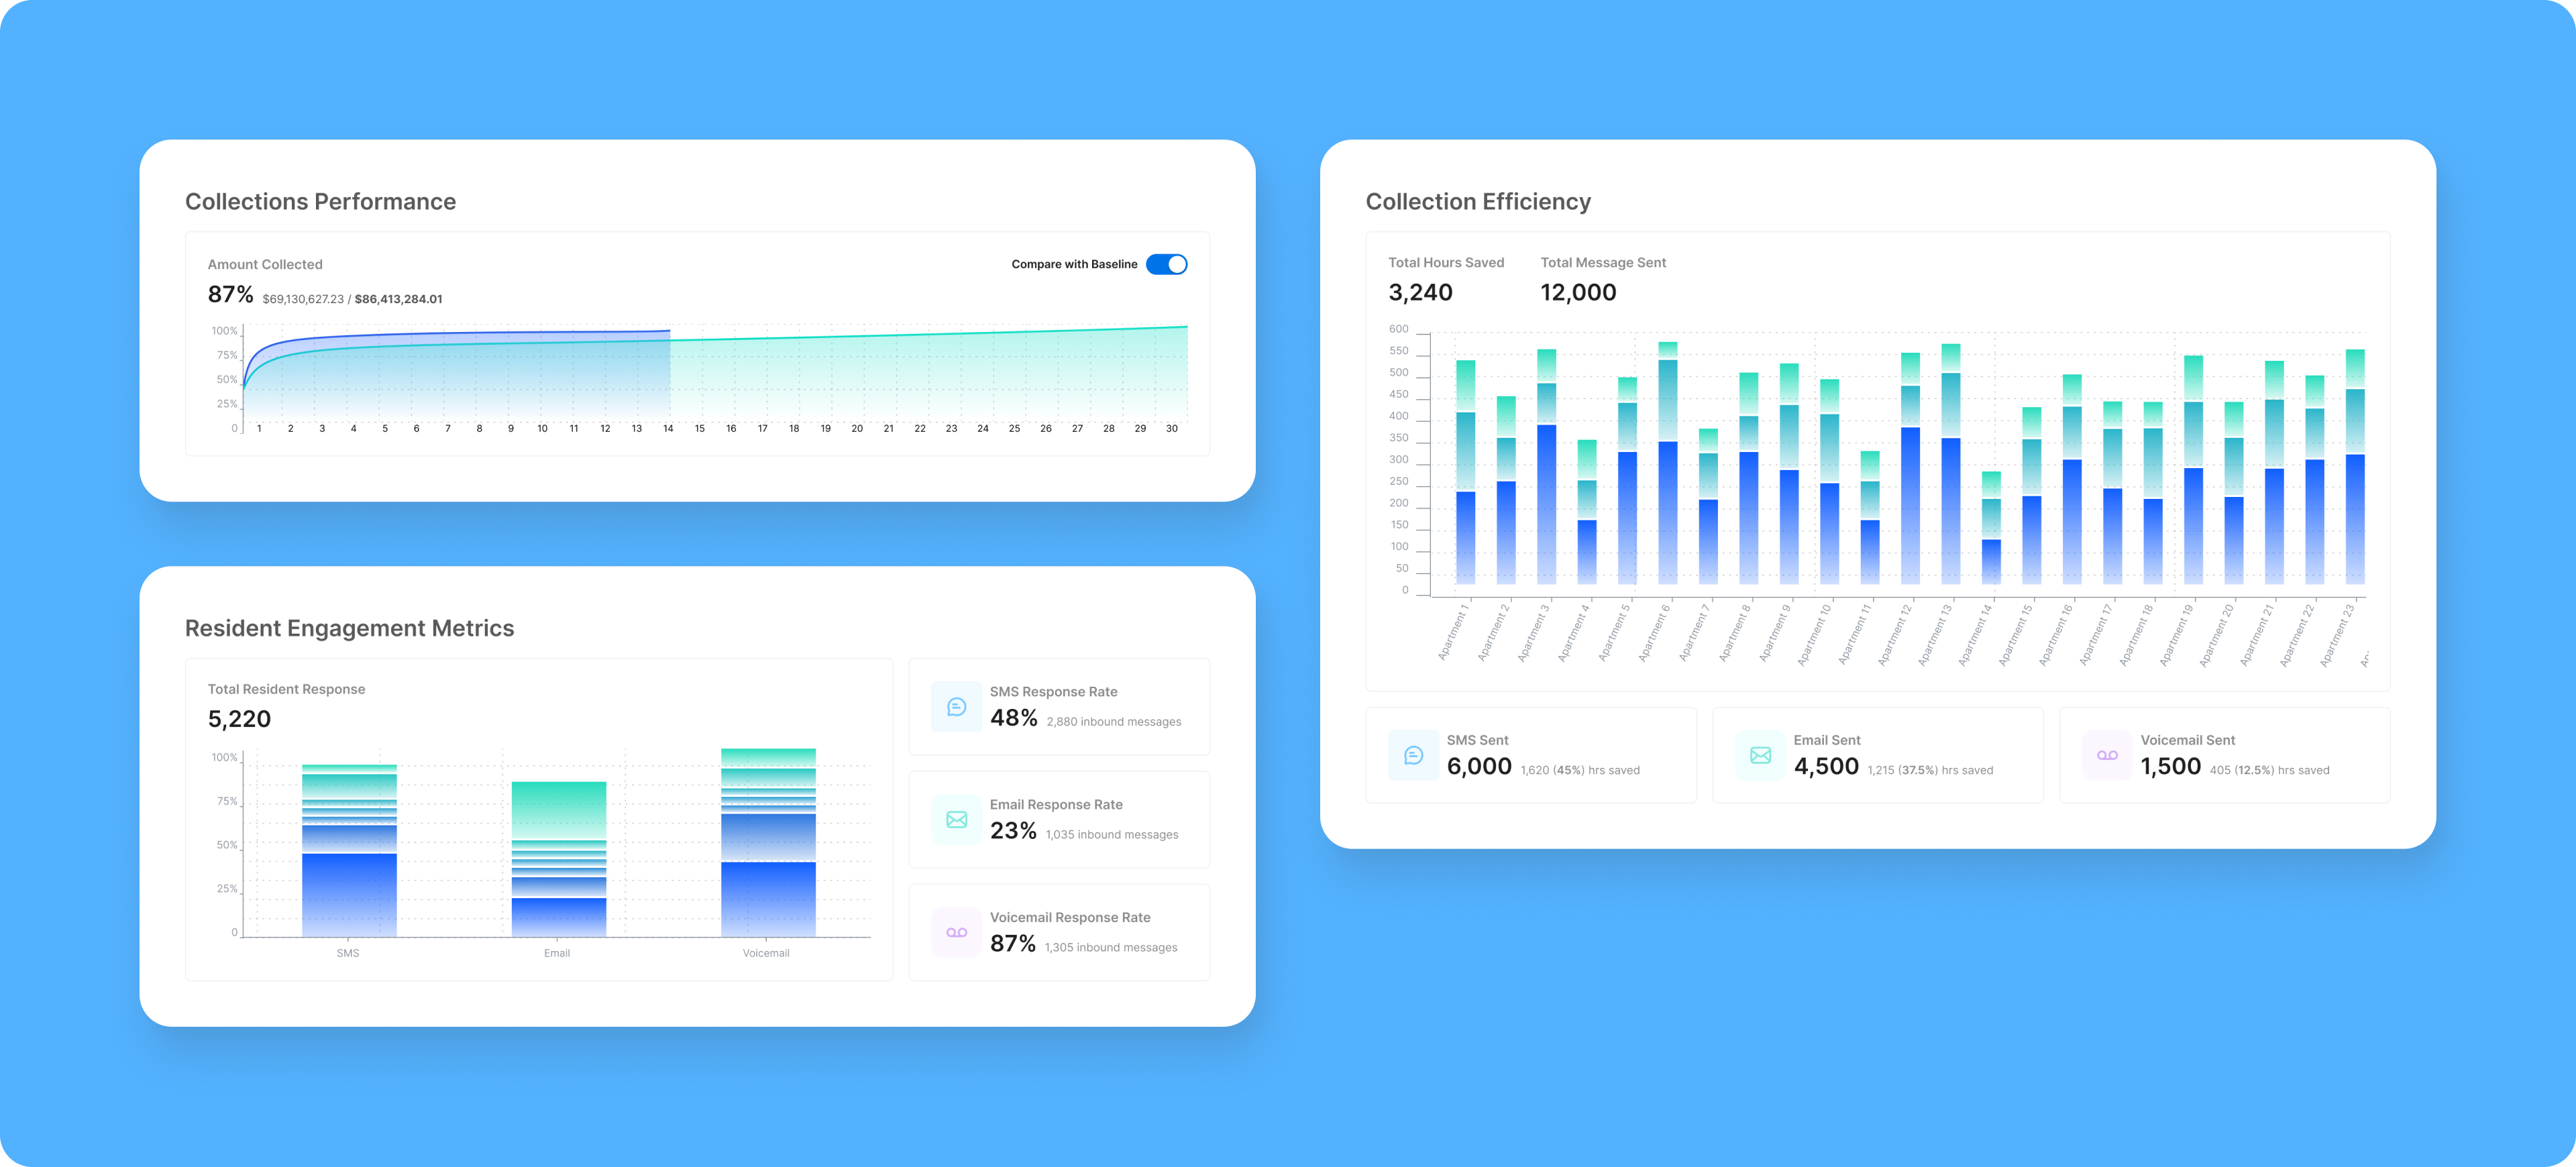
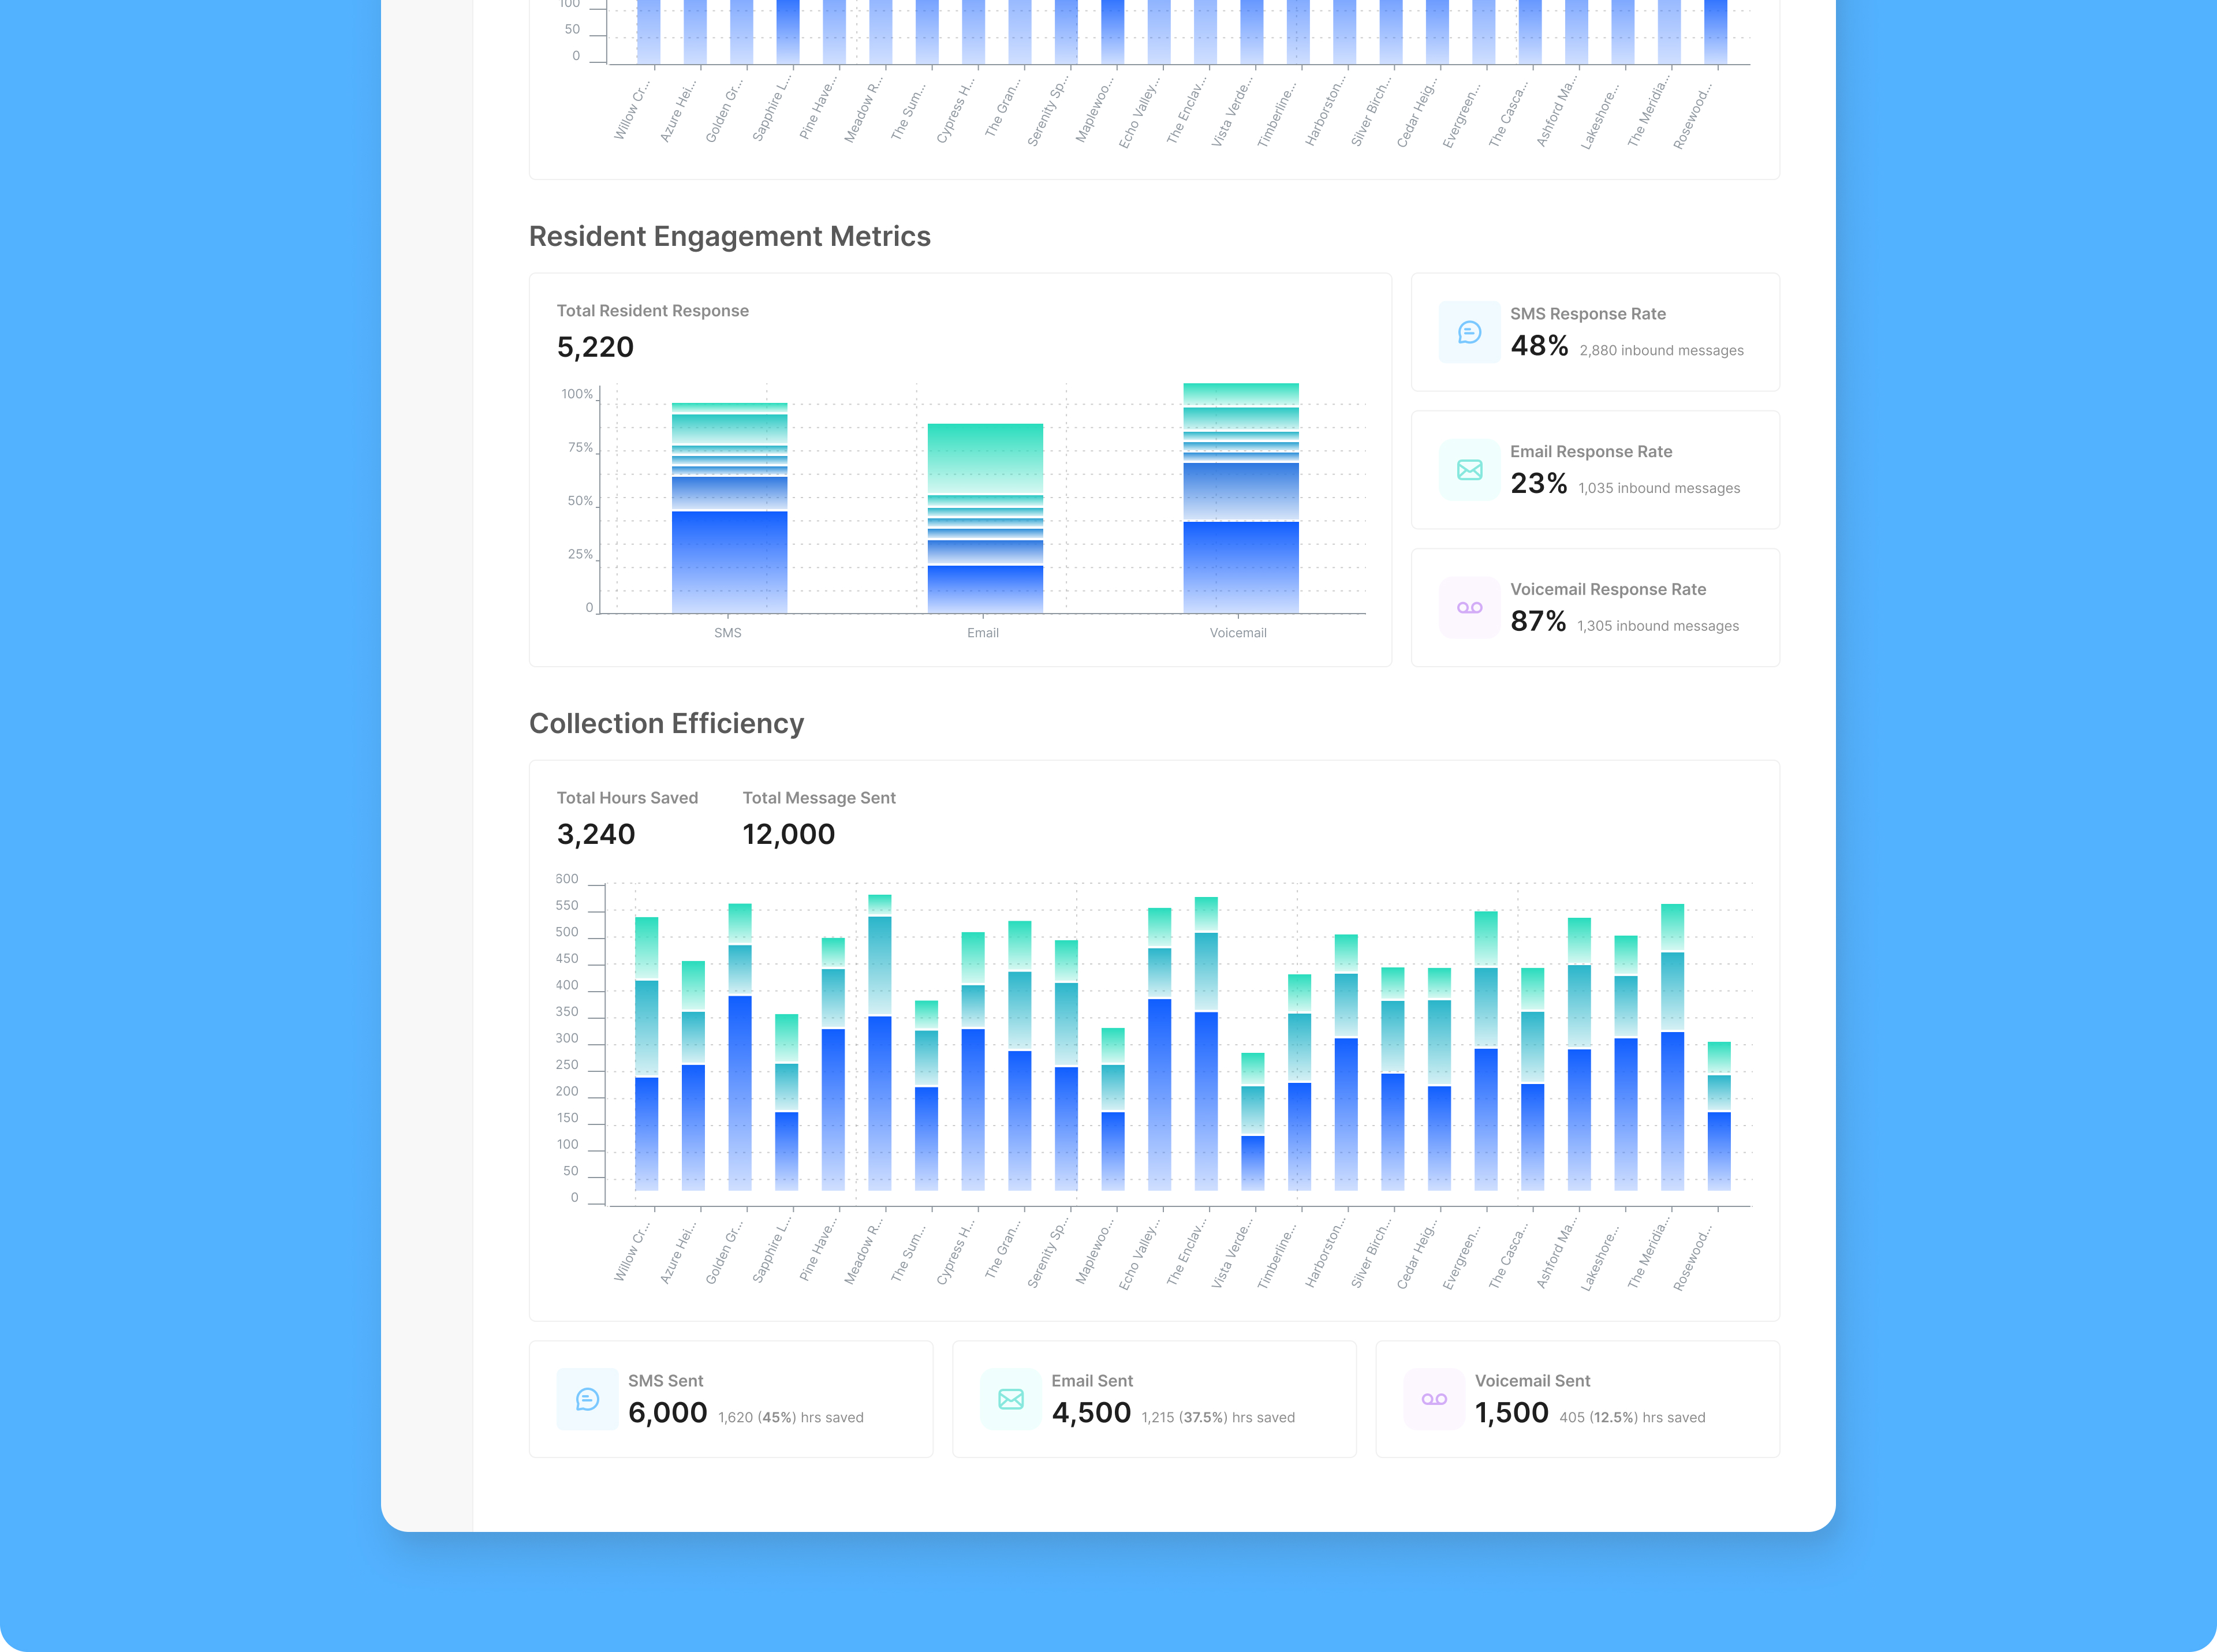
We intentionally cut sections like Resident Engagement and Collection Efficiency (messages sent, hours saved), they highlighted AI output, not client outcomes. Through interviews, I learned clients cared less about automation activity and more about tangible results: reduced delinquency and faster collections.
Outcome
The Delinquency Dashboard became a portfolio-wide visibility tool for corporate, regional, and on-site teams. It eliminated weekly manual reporting, provided live tracking across communities, and helped secure a centralized client who valued unified oversight.
One client’s reaction captured the win perfectly:
“I’m logged in and checking it out. I love this tool!”
Lesson Learned
Balancing Client Requests with Real Needs
This project reminded me that what clients ask for often differs from what they truly need. By digging deeper through user research, I learned to separate surface-level requests from underlying goals, turning a feature ask into a solution that created real operational value.
Aligning Business Goals with Customer Value
Internally, the team wanted to highlight AI activity and time savings, but clients measured success by faster collections and reduced delinquency. This project reinforced the value of aligning product metrics with what customers truly care about, not just what we want to showcase.